This article is a write up of a talk that I will give at the osmc in Germany in November about Distributed tracing. It is a sequence of questions I got about distributed systems and distributed monitoring.
Why do I need distributed tracing?
It always depends, I find distributed tracing useful in a microservices environment or more in general when there is a request that flies in a system crossing different applications, queues or processes. If you have a problem understanding where a request fails, you need to follow it in some way and tracing does just that.
how do you follow a request?
First of all, we should probably change the name request, it looks too HTTP oriented, and it is not really what we look for now. In modern application, you are interested in events. You need to monitor an event:
- user registration
- payment
- a bank transaction
- send an email
- generate an invoice
These are all events, and probably in your system, they are distributed not via
HTTP but maybe they go in a queue, or they are broadcasted using Kafka or Redis.
Distributed tracing is all about tracking events. The way to go is to create an
id. Usually, it is called request_id or trace_id and you need a way to
propagate it in your system.
For example, in a queue, you can put the trace_id as part of the payload. Via
HTTP or gRPC you can use Headers.
Your application can take that id, and it can create the span to trace a particular section.
how a trace looks like?

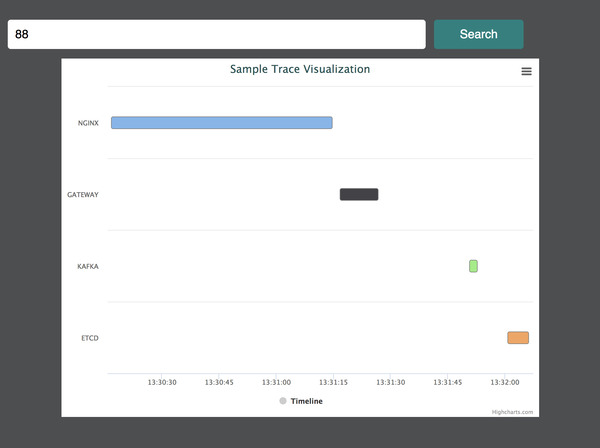
In my mind, this is a picture for one trace. Every segment is a span.
So, every span has a trace id, and every span has its own span_id.
You can attach information to every span as key value store. Let’s suppose a
span represent a query in mysql you can put the query as metadata in the span
itslef. In this way you will have a bit more context.
do we need a standard for tracing?
I can’t convince you that interoperability is essential if you already analyzed the problem and you answered “No” to yourself. To build a trace you need to agree on something over languages and applications. That’s why I think a standard is something you can not avoid, at the end you will end up having one just for your company.
how a tracing infrastructure looks?

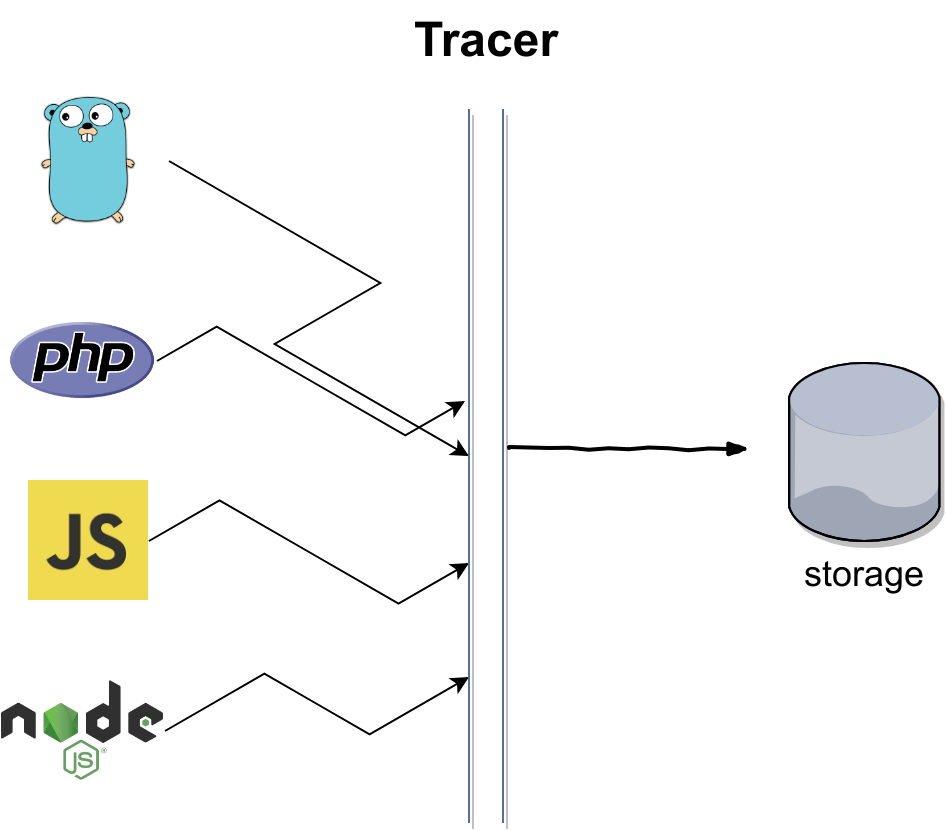
The applications that are writing traces is not important. Traces is cross platform and languages. Usually, you point an app to a tracer. It can be Zipkin, Jaeger or others.
The tracer takes all the traces, and it stores them in a storage. The databases are usually ElasticSearch, Cassandra, InfluxDB. It depends on which tracer you are using. They support different databases.
In general traces are high cardinality oriented data, and you can write a lot of them in a short amount of time. So it is a write-intensive application.
There are a couple of other pieces that you can add in your tracing infrastructure:
- You can add a downsampler to select what to store. If an API request generate
too many traces probably you are interested in storing only a % of them to
decrease pressure on your database. So you can use a simple distributed hash
algorithm on the trace_id to declare what to save or not. A
modon thetrace_idis enough for example. - You can add a collector in front of the tracer. Zipkin support Kafka For example. In InfluxDB we use telegraf. A collector is usually a stateless application, it gets all the traces from the applications. It bulks them and sends them to the tracer. A collector decreases the pressure on the tracer itself because usually, they work better with a bulk of data. In second if a tracer go down or you need to update it, the collector is a layer that can keep the traces for a little bit to give you time to restore the tracer.
why did I pick opentracing?
I am an interoperability oriented developer; I think it is essential to avoid vendor lock-in and embracing a big community like the opentracing one you get a lot of tools and services already instrumented with this protocol. It makes my life easy.
can I have a tracing infrastructure on-prem?
You can; there are a couple of tracers open source.
- Zipkin is an open source project in Java started by Twitter.
- Jaeger looks a lot like a porting of it in Golang and Uber makes it.
Both of them are open source, and they support different backends like ElasticSaerch, Cassandra and so on.
there are as a service tracing infrastructure?
There are, NewRelic has an opentracing compatible API, or Lightstep for example. A lot of cloud providers offer a tracing service. AWS X-RAY or Google Stackdriver.
can I store traces everywhere?
You can, but they are a high cardinality data. The trace_id is usually the
lookup parameter for your queries. It means that it should be indexed, but it
changes for every request. The consequence is a big index.
You need to keep it in mind.
Once you do the trace…then what?
I left this question as the last one because I read it in the opentracing mailing list and I think it is a hilarious question.
First of all, you don’t buy a pan and after the fact you start asking yourself why you have it.
Probably you need to write something, and for that reason, you buy a pen.
Anyway, I trace my applications because it helps me to understand my environment over the “distribution complexity.” I can detect what is taking too long and a trace helps me to understand what to optimize.
Opentracing has a set of standard annotation very useful to detect network latency between services. You can mark a span as “client send” request for example. And when the server gets the request, you can mark another span as “server received.” This two information is useful to know how much time your request spends going from client to the server and you can optimize them time usually working on the proximity between these two applications.
More in general you can parse a trace to get what ever you need as normal logs or events the powerful things is downsampling and analysis. If you are tracing a queue system you can get the average time for a worker to process a message.
Conclusion
Let me know if you have more questions on twitter @gianarb. I am happy to answer them here.