Listen your infrastructure
and please sleep
Gianluca Arbezzano
Software Engineer at CurrencyFair
OpenSource maintainer


Widespread monitoring tool
tail -f /var/log/nginx/errors.log
2016/04/15 15:42:46 [warn] 2330#0: *167 using uninitialized variable,
    client: 10.0.1.1, server: localhost.dev, request: "POST /auth HTTP/1.1",
    host: "localhost"

2016/04/15 15:44:44 [error] 2330#0: *171 FastCGI sent in stderr: "
    PHP message: PHP Fatal error:  Uncaught exception
    'RuntimeException' with message 'All broken)[500]'
    in /var/www/my/project.php:237

Stack trace:
#0 /var/www/index.php:45 ObjectService->flush()
#1 [internal function] ->save()
Expensive to store
Difficult to index
Difficult, not impossible


They are awesome for some use cases
- extract information
- They can be "human like"
- ... you have your personal list
we are here to speak about time series
[
  {
    "name": "log_lines",
    "columns": ["time", "line"],
    "point": [1400425947368, "here's some useful log info"]
  }
]
Only one word: EASY
{
  "name": "cpu_percent_use",
  "columns": ["value"],
  "point": 40
}
Cheap
If you try to reduce your time series to a timestamp and a value
Complexity doesn't mean better
Scalable
The time is a perfect shard key
There are few tools and services


InfluxDB
- database optimized to manage time series
- telegraf to collect and push metrics
- kapacitor to trigger alerts
InfluxDB outperformed Elasticsearch in all three tests with 8x greater write throughput, while using 4x less disk space when compared against Elastic’s time series optimized configuration, and delivering 3.5x to 7.5x faster response times for tested queries.InfluxDB markedly Elasticsearch
- opensource
- pure go
- made easy
line protocol
serialization protocol created to be slim
[key] [fields] [timestamp]
temperature,machine=unit internal=3,external=10 1434055562000000035
UDP and TCP protocol
Corley\Benchmarks\InfluxDB\AdapterEvent
    Method Name                Iterations    Average Time      Ops/second
    ------------------------  ------------  --------------    -------------
    sendDataUsingHttpAdapter: [1,000     ] [0.0026700308323] [374.52751]
    sendDataUsingUdpAdapter : [1,000     ] [0.0000436344147] [22,917.69026]
Query SQL like
SELECT value
    FROM cpu_load_short
    WHERE region='us-west'
continuous query
CREATE CONTINUOUS QUERY minnie ON world
    BEGIN SELECT min(mouse) INTO min_mouse
    FROM zoo GROUP BY time(30m) END
Telegraf
Telegraf is a plugin-driven server agent for collecting and reporting metrics
[global_tags]
  dc = "do-ams-3"
  name = "db1"
[agent]
  interval = "10s"
[[outputs.influxdb]]
  urls = ["http://localhost:8086"]
  precision = "s"
[[inputs.cpu]]
  percpu = true
  totalcpu = true
Kapacitor
Kapacitor is a data processing engine. It can process both stream and batch data
Follow your metrics and send notification when one of them has a strange behavior
Kapacitor
stream
    |from()
        .measurement('cpu')
    |alert()
        .crit(lambda: "usage_idle" <  70)
        .log('/tmp/alerts.log')
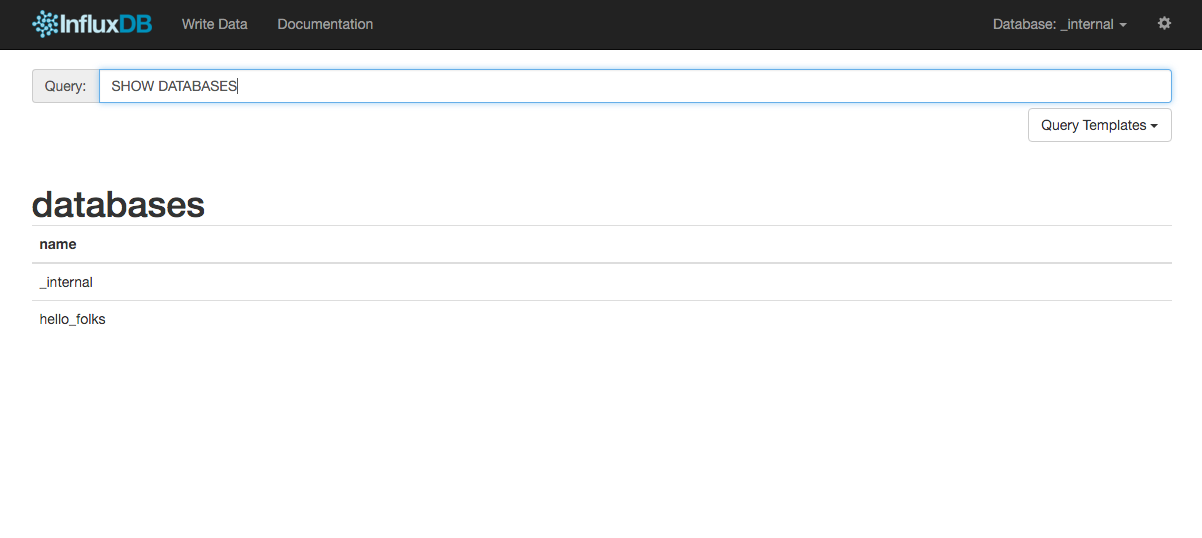
InfluxDB admin panel
To manage your data
Graphite
Demo time
https://github.com/gianarb/demo-devops-conf
That's it
A series of great tools to monitor your applications and your infrastructure