Symfony is one of the most famous PHP Frameworks in use right now, today we are going to use it to understand how much is important to know how one our features performs. We don’t monitor CPU usage, I/O disk or the number of server errors but we are monitoring the final feature from the business point of view. This approach is very important because understanding which is the impact of a new release on a specific, critical feature is the best way to understand how a customer use our service.
In this article we are implementing a monitor for one of the most diffuse business requirements, the authentication.
In order to understand how many people try to do a login, and track how many of them perform a wrong authentication and use this metrics to understand how the system evolves. Sometimes happens that right after a deploy the number of wrong logins grows faster than usual, this could be a sign that the feature doesn’t work as expected. We begin from the standard Symfony application
$ composer create-project symfony/framework-standard-edition influxdb_app
$ cd influxdb_app/
$ php bin/console server:run
We create a route under authorization (/admin), it is private and only admin users are allowed to see that and one public homepage (/).
You can follow the official tutorial, or this step from the Symfony application directly from GitHub. We have an admin panel and a public site, the idea is use our InfluxDB PHP SDK to understand how this feature works. We use the Dependency Injection Container (DiC) provided by Symfony to create our influxdb.client.
Go into the project’s root and use composer to install the library: composer require influxdb/influxdb-php The first things to do is add some parameters: host and port of our InfluxDB. To do that open app/config/parameters.yml and add this fields:
influxdb_host: 127.0.0.1
influxdb_port: 8086
influxdb_db: symfony_influx
We use the REST Api to send metrics to InfluxDB, please if your connection params are different change them.
The second step is configure the Symfony’s DiC in order to get our client around the application, open app/config/services.yml and add this line.
services:
    # ...
    influxdb_client:
      class: InfluxDB\Client
      arguments: ['%influxdb_host%', '%influxdb_port%']
    influxdb_database:
      class: InfluxDB\Database
      arguments: ['%influxdb_db%', '@influxdb_client']
With this specification we are asking at the DiC to provide a influxdb_client, it’s a InfluxDB\Client object with two constructor parameters: influxdb_host, influxdb_port.
InfluxDB could have different databases, influxdb_database is a service that use the influxdb_clint to work with only one database influxdb_db. Now we have a influxdb.database ready to be used! Only to try if all works fine open DefaultController and try to send a page view metrics:
/**
     * @Route("/", name="homepage")
     */
    public function indexAction(Request $request)
    {
        $result = $this->get("influxdb_database")->writePoints([new Point(
          'page_view',  // name of the measurement
          1             // the measurement value
        )]);

        // replace this example code with whatever you need
        return $this->render('default/index.html.twig', [
            'base_dir' => realpath($this->getParameter('kernel.root_dir').'/..'),
        ]);
    }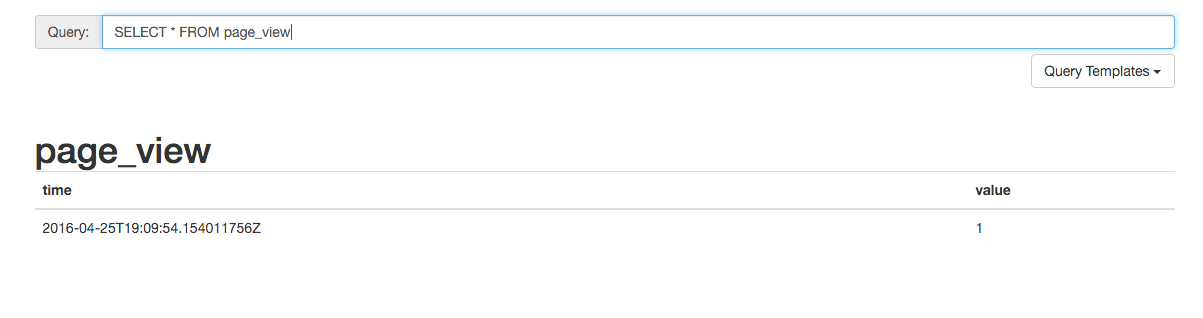
Go into the homepage and in the meantime do a query like SELECT * FROM “symfony_influx”.”“.page_view into the InfluxDB’s admin panel, you are sending a new point after each visit! Very good but we have another target! If you have some problem and you are using my repository see the difference between this and the last step on GitHub.
Sent a point in this method it’s not a good practice because our controller has two responsability: Rendering of the page Sent a point In this example the situation is not dangerous because the application is very easy and with a very low traffic, but symfony provide a strong event system, perfect to split the logic on different classes and simplify our code, we try to follow this approach for our last step, we create a listener to sent a point when an user fails a login. In first we must create a listener into src/AppBundle/Listener/MonitorAuthenticationListener.php.
<?php
namespace AppBundle\Listener;
use Symfony\Component\Security\Core\Event\AuthenticationFailureEvent;
use InfluxDB\Point;
class MonitorAuthenticationListener
{
    private $database;
    public function __construct($database)
    {
        $this->database = $database;
    }
    public function onFailure(AuthenticationFailureEvent $event)
    {
        $this->database->writePoints([new Point(
            'login',
            1,
            ['status' => 'error']
        )]);
    }
}
We use the DiC to attach this listener at the security.authentication.failure event. This event is called after each failed login. To do that open app/config/services.yml and add this configuration.
services:
    # ....
    security.authentication.monitoring:
        class: AppBundle\Listener\MonitorAuthenticationListener
        arguments: ['@influxdb_database']
        tags:
            - { name: kernel.event_listener, event: security.authentication.failure, method: onFailure }
We are injecting into the constructor our influxdb database, in this way we use it to send points like our old example into the controller. This is the last practical section of this tutorial, please if you have lost something try to check this diff from the last step on GitHub. Try to do some wrong login and check the situation into the Admin Panel with a query like
SELECT * FROM "symfony_influx"."".login.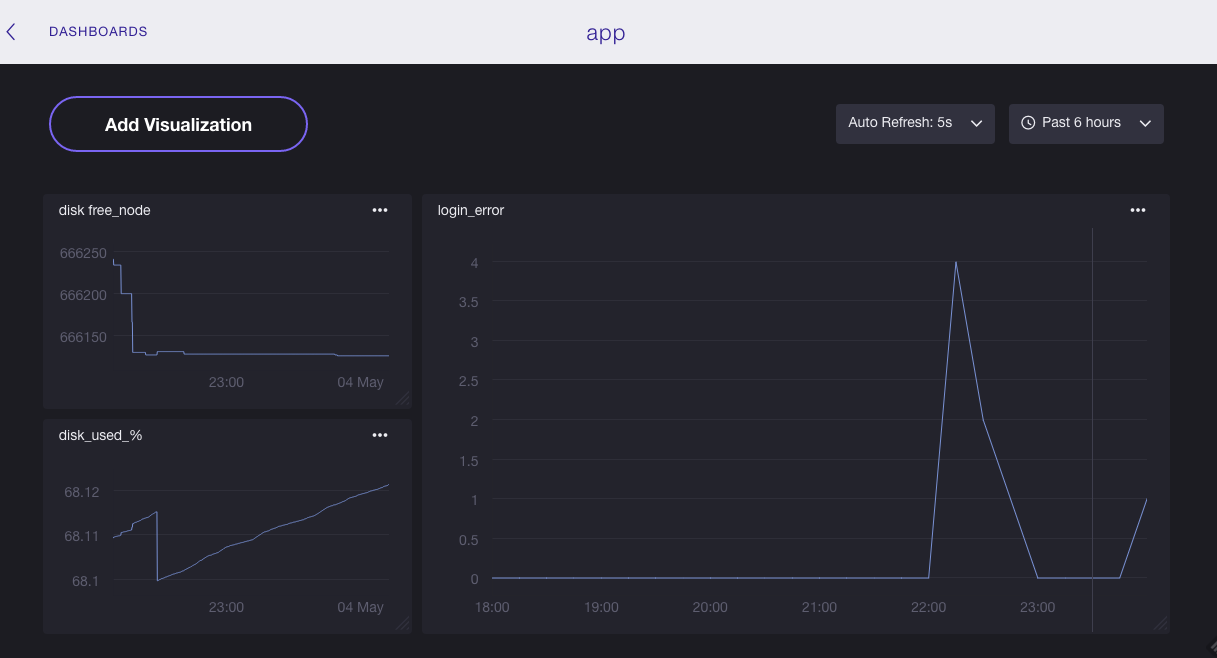
The admin panel is not the best way to check our metrics, InfluxData provide a great dashboard called Chronograf, try to use this metric to create a graph specific to understand how your feature works. This post is only a getting started to understand a good way to send metrics without connect directly your business logic with the monitoring system, but with a real traffic this approach is totally inefficient.
Send point by point increase the traffic in your network and the latency create performance problems, telegraf is a collector that you can use to mitigate this problem, in this way you can not send your points directly to InfluxDB but you can use this agent installed on your server that collect and send bulk of data for you.